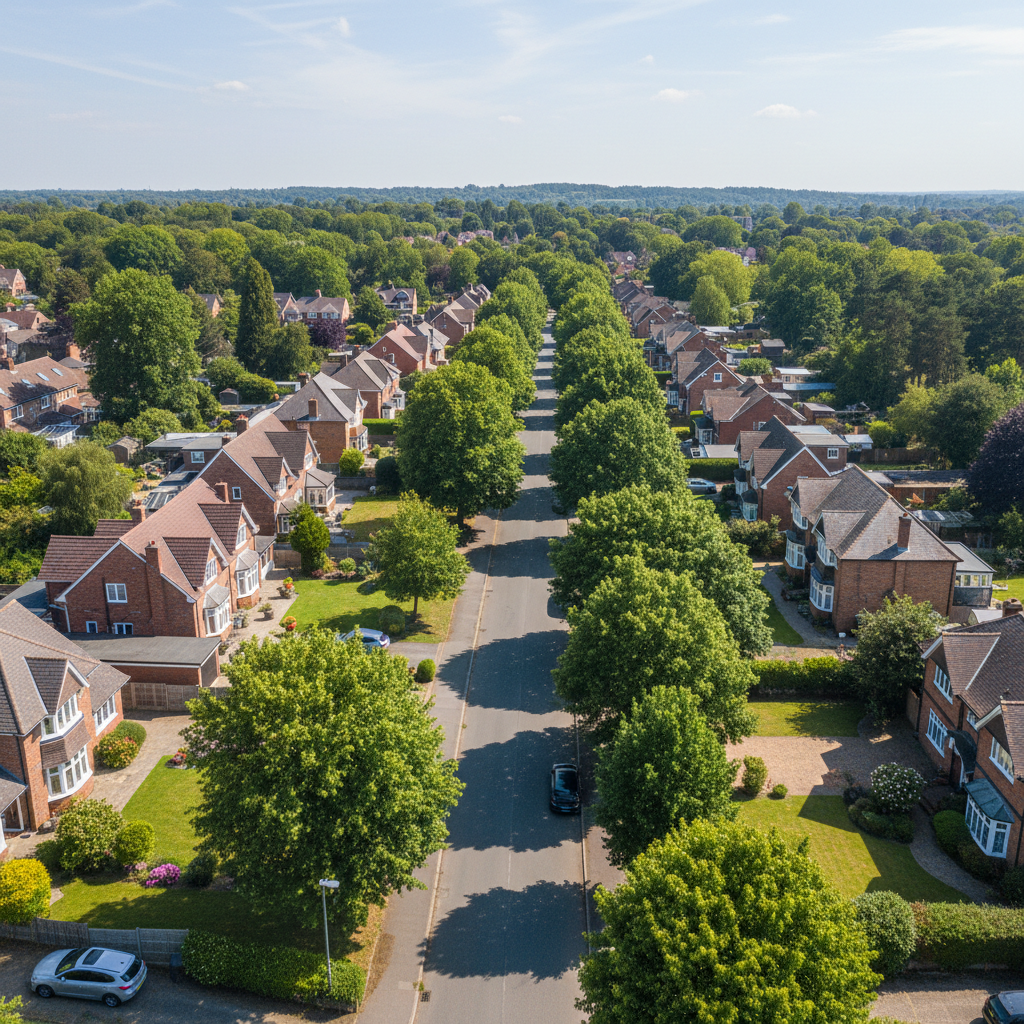
The property market in IG10 3 is currently defined by a steady equilibrium. While some might expect the summer heat to lead to a frenzy of activity, the data suggests a much more composed environment for both those moving in and those moving on.
I’m Daniel Lewis, and as I’ve been walking the streets from the leafy stretches of Stonards Hill over to the bustling corners of Valley Hill this August, I’ve noticed a shift in the landscape. The conversation isn't about how fast the market is moving, but rather the volume of choice available to those looking for a new home.
Understanding the Supply Balance
The most significant metric in IG10 3 right now is the ratio of available housing supply relative to current buyer demand. We currently have a supply level that represents 9.1 months of market activity. In plain English, this means that for every ten buyers currently active in the market, there are roughly 91 properties available for them to consider.
Think of it like a bakery that has 91 loaves of bread on the shelf but only ten customers walking through the door each day. There’s no mad rush at the door, and nobody is fighting over the last baguette because the stock levels are healthy. Because this ratio is over six, it officially means we are in a "Balanced Market." It’s not a situation where sellers can name any price due to a shortage, but it’s also not a market where buyers can demand huge discounts. It’s a steady, fair environment where both sides have an equal amount of leverage.
What’s in the Shop Window?
Right now, across the whole of IG10 3—from the grand houses on Alderton Hill to the family homes on Southview Road—there are 75 properties currently for sale. That’s actually six fewer than we had last month.
Even though there are slightly fewer homes to choose from, the level of market activity remains consistent. We are seeing a steady flow of approximately 8 homes finding buyers every single month. It’s a bit like a local bus service; it’s reliable and consistent, providing a predictable level of turnover in the local housing stock.
The Price Gap Explained
Here’s a detail that might seem contradictory at first glance: while the average asking price (the figure sellers are currently quoting) sits around £477,290, the actual sold prices recorded over the last year are higher, at £498,283.
How can that be? It comes down to the quality of the housing supply. We’ve seen some spectacular transactions recently that have bolstered the averages. For instance, a stunning home on Alderton Hill recently sold for £5,000,000, while a lovely spot on Valley Hill achieved £900,000. These figures show that while the market is "balanced," buyers are still willing to pay a premium for high-quality stock in the right street.
What does this mean for your front door?
If you’re thinking of selling: You don’t need to worry, but you do need to be aware of the competition. Because there is a significant amount of choice for buyers, your home needs to look its absolute best to stand out from the other 74 options currently on the market. You are competing for the attention of a specific pool of buyers, so presentation is key.
If you’re looking to buy: You have the luxury of choice. With current stock levels where they are, you don’t necessarily have to make a pressured decision in the driveway after a five-minute viewing. There is enough housing supply on the shelves for you to be discerning about your next move.
If you’re staying put: Your home is in a very stable neighbourhood. We aren't seeing wild swings or unpredictable shifts in market activity. IG10 3 is proving to be a safe, steady place to hold property assets.
Whether you’re in a flat or a five-bedroom house, the August heat hasn't caused the market to boil over—the balance of supply and demand is just right.